OWDashboardCaseTrend
Ontario Works
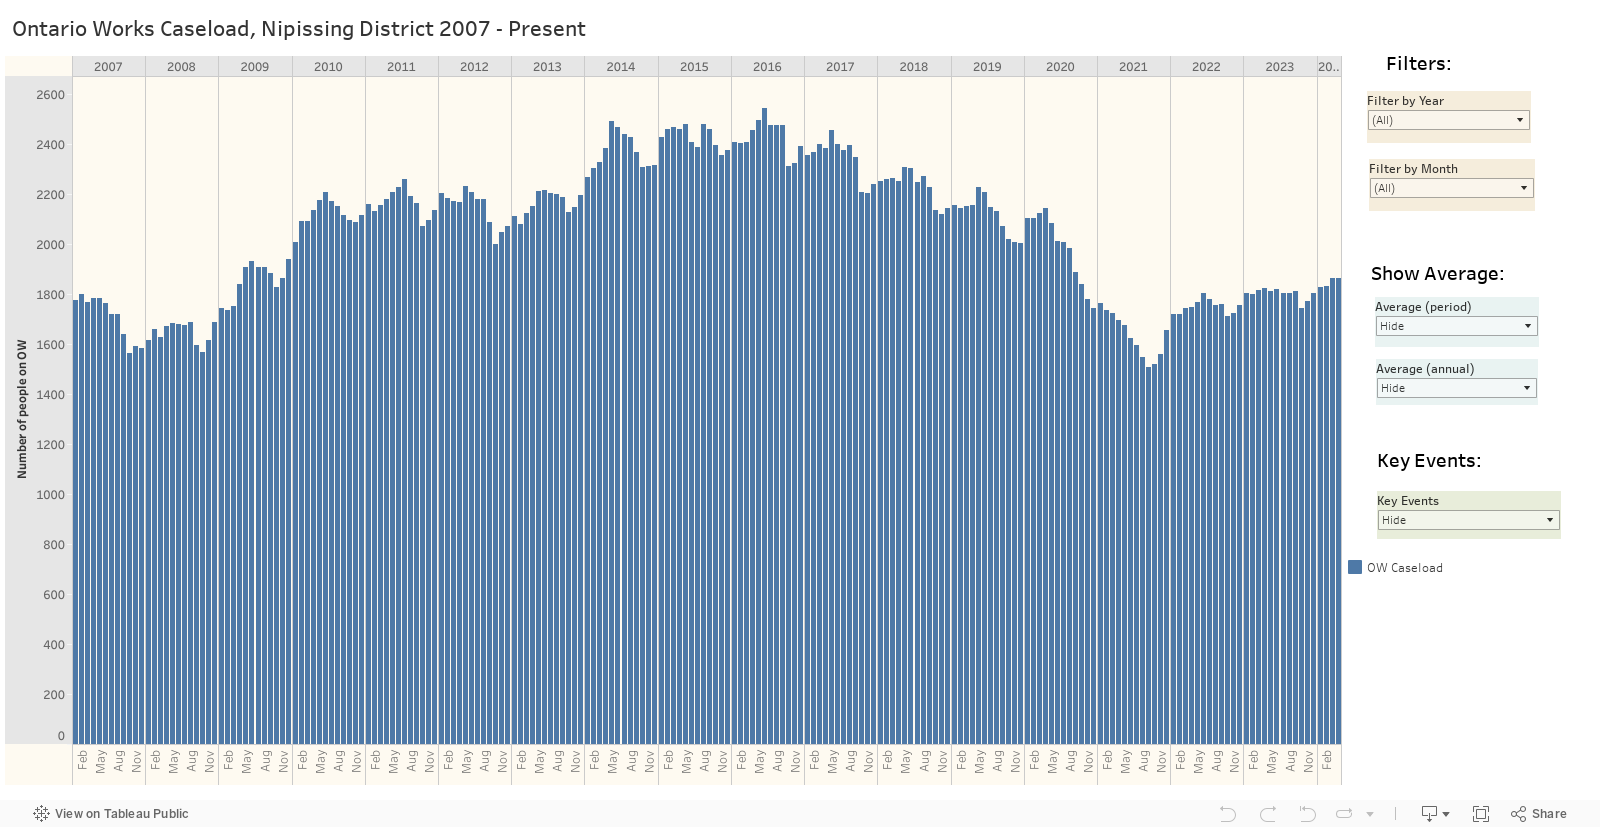
This dashboard shows the Ontario Works (OW) caseload in the Nipissing District over time, from 2007 to the present, displayed as monthly counts of individuals receiving Ontario Works social assistance. The chart allows viewers to observe long‑term trends, seasonal patterns, and periods of growth or decline in the caseload. Filters for year and month enable closer examination of specific time periods, while optional average lines provide additional reference points. The Key Events legend can be toggled on to overlay significant external and program‑related events-such as economic changes, policy shifts, and the COVID‑19 pandemic-directly onto the chart, helping to place changes in the caseload within their broader social, economic, and policy context.
What is a case? A case refers to a single individual or a family unit on social assistance.
What is a beneficiary? The number of beneficiaries refers to the total number of single individuals and heads of family units on social assistance plus all their dependents (that is, spouses, dependent children and dependent adults).
Why are numbers not adding up? Numbers may not add up due to rounding.
